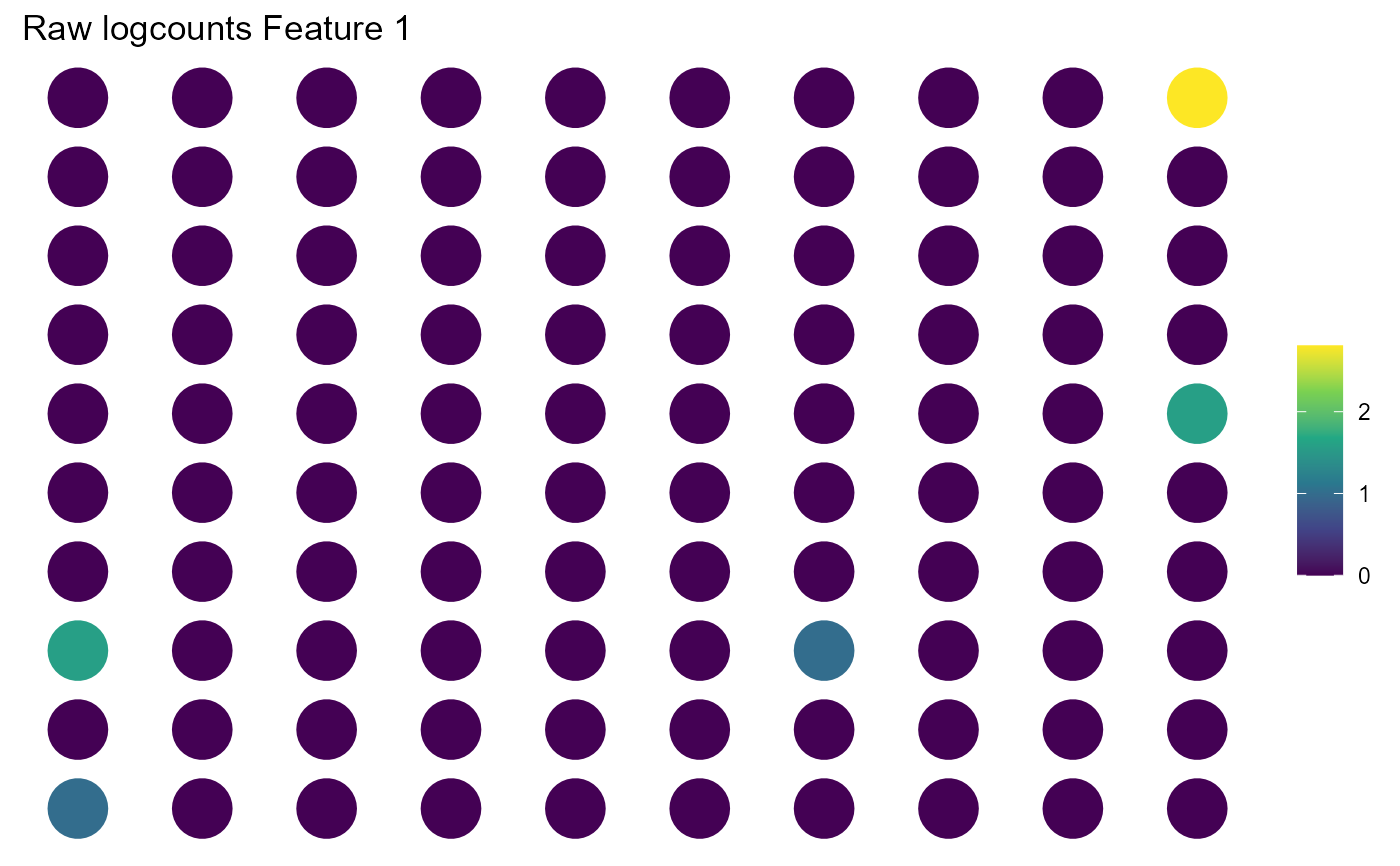
Create Spatial Plot of Feature Expression or Cluster Labels
Source:R/spatial_plot.R
spatial_plot.RdCreate Spatial Plot of Feature Expression or Cluster Labels
Usage
spatial_plot(
  input,
  type = c("raw", "smooth", "cluster"),
  feature_name = NULL,
  labels = NULL,
  assay_type = "logcounts",
  spot_size = 1.5
)
Arguments
- input
SummarizedExperiment object containing counts assay and row/col coordinates.
- type
Plot type, "raw", "smooth, or "cluster". If "raw", the expression of feature_name using assay_type is plotted. If "smooth" the smoothed expression of feature_name is plotted. If "cluster" the cluster labels are plotted. If type="cluster" and labels=NULL, the smoothLRC labels are used.
- feature_name
If type="raw" or type="smooth", the name of the feature to be plotted.
- labels
If type="cluster" a vector of labels for each observation. This should be the same length as the number of columns of input. If NULL, smoothLRC cluster labels are used.
- assay_type
If type="raw" or type="smooth", the SummarizedExperiment assay type.
- spot_size
The size of each pixel.
Examples
sce <- example_sce()
spatial_plot(sce, feature_name = "Feature 1", spot_size = 10)